Way back a few presidents ago, President Ronald Reagan once famously said, “Trust, but verify,” during the height of the Cold War. While he was talking about nuclear warheads and our enemies’ capabilities, “trust, but verify” isn’t a bad philosophy for higher education institutions either. Accordingly, let’s take a gander at what the colleges in the Texas State Technical College System are saying about their student placement, and then let’s take a look at the state data, much of which, by the way, is provided to the state by the colleges.
Of course, to do that, we’re going to need some source data, so please open the link contained in the highlighted text to get to the TSTC System placement web page that, in turn, has links to each of its four major colleges’ individual placement rates. Once you get there, take a look at what TSTC Harlingen says its various programs’ placement rates are by clicking on the link for Harlingen. Now, when you click on that link, you don’t go to another web page. Instead, it’s just a little harder to get to. You have to download a PDF document. Go ahead and click on the link, though, and then select “open with Adobe Acrobat 9.5.” The Harlingen site’s placement PDF document should come up. Take careful note that Harlingen, as indicated in the heading of the document, is providing results for the 2010-2011 academic year. Here’s what I got when I downloaded it. (Note that the second page is missing from the image below. Download the PDF as outlined above to view it.) Click on the image to enlarge it.
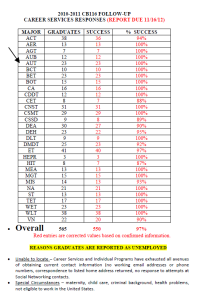
TSTC Harlingen Placement Report for 2010-2011 Posted on the College Website
Next, open the link in the following highlighted text to open the Texas Higher Education Coordinating Board’s Automated Student and Adult Learner Follow-up System (ASALFS) web page. This site is interactive, meaning you’ll have to make some selections to get at the data you want. Now, under “ASALFS Results by Institution,” click on the drop-down arrow, scroll most of the way to the bottom of the list and select “TEXAS STATE TECHNICAL COLLEGE – HARLINGEN.” Next, under “Select a Report Year,” select 2010-2011 (to match the year on the placement report TSTC Harlingen provides on its website) and click on “View PDF.” TSTC Harlingen’s state-generated ASALFS results should come right up.
While readers are certainly welcome to compare every figure Harlingen provides with the numbers the state provides, I picked one more or less at random, “AUT” or, as the Texas Higher Ed Board calls it on its site, “Automobile/Automotive Mechanics Technology/Technician,” and took a hard look. (“More or less at random” means I had to pass over a couple of technologies that I didn’t even know what the abbreviation stood for. I wonder how many visitors can identify all of those technology abbreviations. Prospective students?) The results of that look are instructive and bear out President Reagan’s admonition to verify.
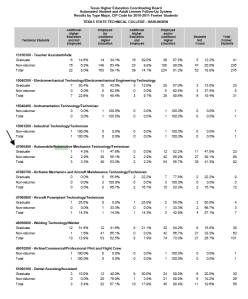
TSTC Harlingen ASALFS Report 2010-2011, page 3 of 8 pages
Now that we have our source data downloaded from both Harlingen and the state, let’s begin our comparison by examining the report we obtained from Harlingen’s website. The college’s claim regarding its automotive technology graduates is straightforward enough: 23 in the graduates column and 23 in the success column for a 100% “success” rate in the final column. There’s absolutely no explanation as to what constitutes a success. My question to you, dear reader, is this: What will a kid looking to become an auto mechanic think when he or she sees that 100%?
Now let’s compare that unexplained 100% with what is in the state’s ASALFS report.
First off, note that we get some information not even hinted at on the report on Harlingen’s website: dropouts or “non-returners,” as they’re labeled. Of 92 total students, 69 of them dropped out. 69. Only 23 students, 25%, made it to graduation. That’s an important little stat right there. Almost 54% (30 of 56) of dental assistants made it to graduation. Almost 75% of students studying Electromechanical Technology made it to graduation. On the other hand, less than 15% of those studying to be a Teacher Assistant/Aide made it all the way to graduation. If I were a prospective student, that would be something I would want to know before I signed up. Maybe it reflects on the students who signed up for the program; maybe it reflects on the program’s staff. I don’t know. I don’t have the data to even come up with a hypothesis. Regardless of the reason, a technology with a high dropout rate would make me a little nervous if I were thinking of registering. It’s a stat prospective students should know.
Now let’s look at those other figures provided by the state. All the way to the left in the graduate row, we see a “1” and “4.3%” under “Additional Higher Education and Not Employed.” Translation: the student transferred to another college. That counts as a success for TSTC Harlingen. Does that kid looking at Harlingen’s website and that 100% know that? Transfers’ counting as successes for academic students makes sense. While a significant part of a traditional community college’s mission is to prepare students for additional higher education at a four-year institution, I’m not so sure that the mission of an auto mechanic curriculum is to prepare students for more college. I believe any technology’s mission is to get students program-related jobs.
Now let’s look at the next category: “Employed and No Additional Higher Education.” In other words, those students showed up, studied, graduated, quit higher ed altogether, and got jobs. BUT WHAT KIND OF JOBS WERE THEY? Well, let’s take a look at the definitions on the ASALFS website:
EMPLOYED AND NO ADDITIONAL HIGHER EDUCATION
– Students found in the employment records as employed during the 2nd quarter following the program year in which they left postsecondary education and not enrolled in a Texas public higher education institution in that same Fall (sic).
Notice something missing from that definition? Yep, you guessed it. There’s no phrase like “employed in their field of study” or “employed in a program-related job” anywhere to be found. In short, dear reader, all students have to do is get “a job” full-time or part-time, and show up in a database the state monitors. Any job will do as long as they show up in that database. That’s why the dropouts in AUT have a higher employment rate (55.1%) than the graduates (47.8%). Any job doesn’t have to be in the technology at all. So a graduate could study AUT, fail to find a job as a mechanic, end up working on a TxDOT road crew slinging asphalt and still count and still be a TSTC Harlingen success. So now we know that 11 graduates got “a job” for a 47.8% employment rate under this column.
For those who might like to know more about the information contained in one of the state’s primary sources, the Unemployment Insurance or U/I database, I offer the link below. The U/I database is used to determine employment rates, although the discussion deals with using it for yet another purpose; nonetheless, the document, a Texas Comptroller letter dating back to 2010, points out what the database conspicuously does NOT contain: the occupations or job titles of the grads in the database. Any job that turns up there counts.
Page from 2010 Comptroller letter discussing the Texas Unemployment Insurance Database
(Go to the ASALFS definitions web page to see the other databases the state uses to compile employment numbers.)
So far we’ve got our 4.3% additional higher ed and not employed rate plus our 47.8% employed only rate for a subtotal of 52.1% on our way to Harlingen’s 100% success rate.
Moving on, let’s take in the next column: “Additional Higher Education and Employed.” Just like the title implies, these are students who moved on to another college AND are working. Do you know anyone who goes to college and works part-time at night at, say, a restaurant as a waiter? I do. Any job counts as long as they turn up in a database, just like the previous category. Here’s the state’s definition:
ADDITIONAL HIGHER EDUCATION AND EMPLOYED
– Students found to be both enrolled in a Texas public higher education institution in the Fall (sic) following a given academic year and employed via employment records.
Under this column, we can see that no AUT students decided to transfer to another college AND work somewhere at the same time. Some other technologies have pretty healthy percentages in this column (e.g., Teacher Assistant and Dental).
Moving on to the next column, we come to “Employed and/or Additional Higher Education.” This column merely aggregates the previous three (4.3% + 47.8% + 0 = 52.2%. (The numbers as they appear here add up to 52.1%, but apparently the state rounded up some numbers to the right of the decimal point that we can’t see in the online report.) Since it’s merely the sum of the previous three stats, this percentage, 52.2%, would normally be AUT’s success or placement rate for 2010-2011, but Harlingen was not going to let the stat in the next column, discussed below, get in the way of its quest for 100% “success.”
The next column, “Students Not Found,” is interesting. Just look at the 11 students, a whopping 47.8%, a figure just as large as those who got “a job,” that didn’t turn up in a database anywhere and nobody could find. But wait! The report on TSTC Harlingen’s website shows 100% for AUT. 100%! One can only assume that it is TSTC Harlingen’s assertion that it found all 11 of those students; otherwise, it would not be able to claim them in the college’s success rate. We’ll just have to take the college’s implied word in that regard, I guess. It’s possible.
Whether one accepts that last implication or not, it is my hope that visitors can see just how much critical information is left unsaid in the success rate on Harlingen’s site. How many people know that transfers to other colleges count as a success for technical students? How many know that getting “a job,” any job that ends up in a state-monitored database, counts as a success whether it’s in the field studied or out of the field, full-time or part-time?
As for the other TSTC colleges, Waco’s online report largely has the same faults that Harlingen’s does. Since Harlingen and Waco dwarf the other two colleges, TSTC West Texas and TSTC Marshall, that’s too bad for prospective technical students. Those students don’t have enough information to make an informed decision.
The good news is that West Texas and Marshall provide quite a bit more information online. For instance, TSTC Marshall actually shows fall 2013 numbers for grads who got program-related jobs (53%) and who didn’t (25%). TSTC West Texas shows (2013 spring, summer, and fall semesters) 65% program-related employment and 11% not related. Good on Marshall and West Texas! I don’t hear or see those numbers advertised, however; nonetheless, they are at least available on their websites.
As I’ve mentioned before, Texas requires private career colleges to reveal graduate rates, program-related employment rates, and placement rates. (See “TSTC Waco Alumni Survey’s Comments: Crying Need to Provide Program-Related Employment Info BEFORE Enrollment.”) Notably, the state does NOT allow private career schools to count grads as placed unless the schools actually have a hand in placing them. Just having grads turn up in a database isn’t good enough for private career schools to take the credit. Those requirements make great sense and are student-centered.
Is what the state allows public technical colleges to do student-centered? Is it? Whose interests are being served when what makes up these “placement” or “success” numbers is not revealed?


